FX Seasonality Forecast for January 2020
Updated FX seasonality based on last 10-year historical data (2009-2019), and how prices moved during the recent holiday season.
Edit: as of June 2020, I stopped using FX Seasonality in forecasting the possible movement for the month ahead, and relied mainly on my old strategy with some tweaks -- particularly with using the COT Futures Report.
Though I didn't really take an actual hiatus in trading during the holidays since I was still swing trading a few pairs along with S&P 500 and BTCUSD (unlike last summer last year), still feeling pissed about not day trading and taking a month-and-a-half break here in this blog in the hopes of avoiding thin trading volume during the holidays.
Also wanted to avoid geopolitical risks around that time: UK general election and US-China trade deal, with only Phase 1 of that deal's official signing delayed from December to January 15 (which convinces me that the main focus for at least the first half of 2020 is still more US-China "talks", more likely causing the equity market to see-saw between 3100-3500. It's pretty much aligned to its elliot wave but I'm gonna talk about that in another post later).
No final figures available yet for 2019 year end-- will update this soon.
Even if my decision to focus more on other things that time (i.e. Amazon FBA, Youtube and my other blog) seemed fairly reasonable because we must take advantage of higher demand, higher traffic and better than average CPM rate around the holiday season, there's still that lingering regret especially after seeing how the prices moved as expected below.
Oh wait, I had slow internet issue around that time as well. I guess it's alright afterall then. 😆
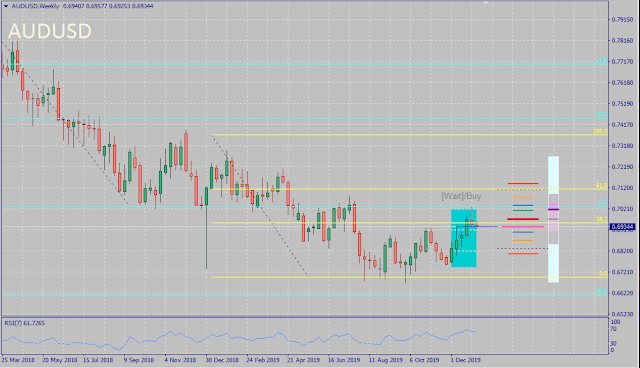
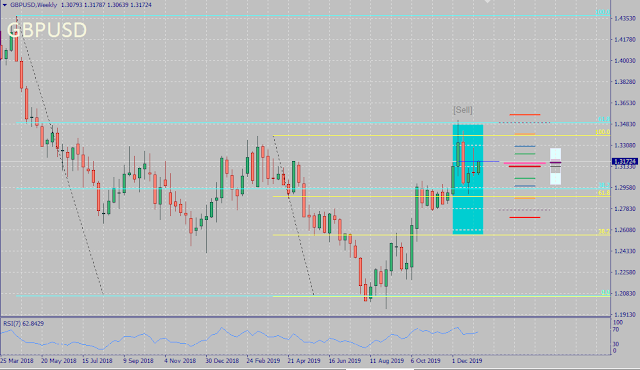
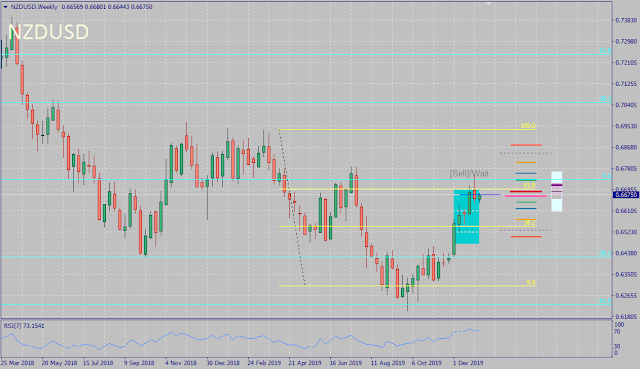
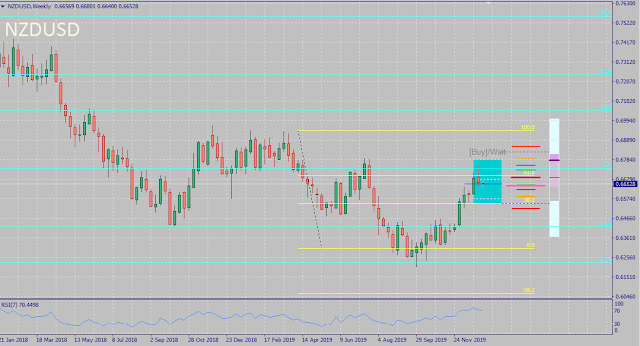
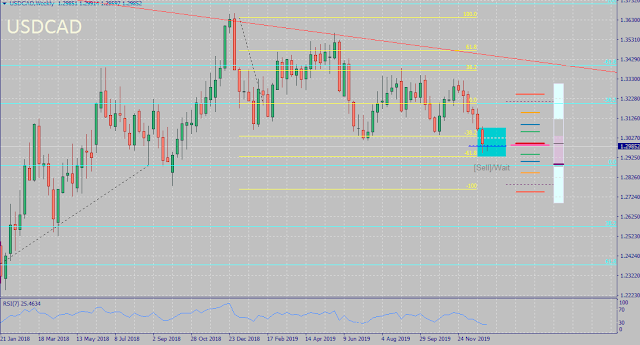
Most currency pairs moved within the expected range for November - December 2019, except for NZDUSD last November, and USDCAD and USDCHF last December.
Although based on fundamentals, I've mentioned in the previous posts how underrated the Kiwi is overall, I didn't expect it to bounce and recover that early especially with risks related to Australia and US-China talks.
When it comes to Swissie, more whales were definitely more into it than usual (just like gold) to hedge current risks in the market.
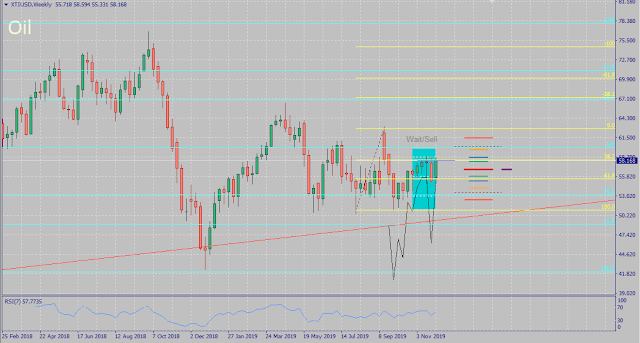
And regarding the Loonie, it's being supported by the recovery in oil because of rising demand during winter-- and expecting it to even rise further after what happened to Iran lately, despite the bearish seasonality forecast for December in oil.
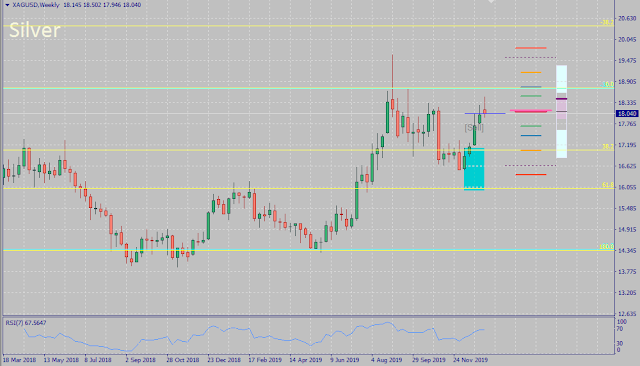
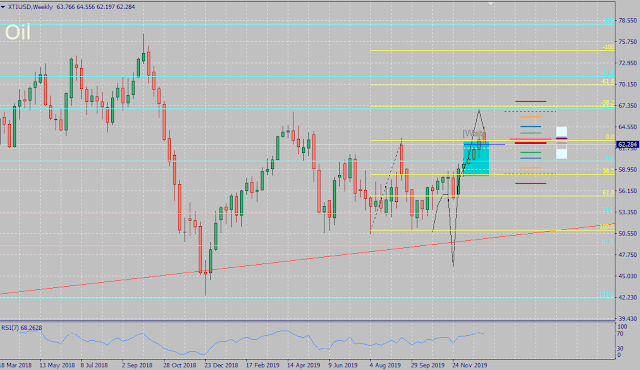
Both metals suddenly went higher than expected as markets anticipated more risks coming from US-China trade deal and wanted to hedge from that. Oil rose too by December because of rising demand.
The FOMO both in the S&P 500's daily chart and the news continues. However if we look at the higher timeframe, it's relatively flat. But contrary to what I initially thought, it's more likely that no impending stock market crash is coming soon (or at least this month) especially with some whales biased against it (or are they doing that so the actual whales won't cash out yet? Hmmm..), and expecting the equities now to continue moving sideways instead.
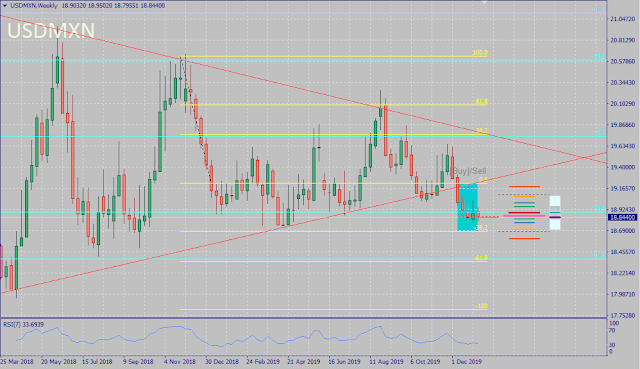
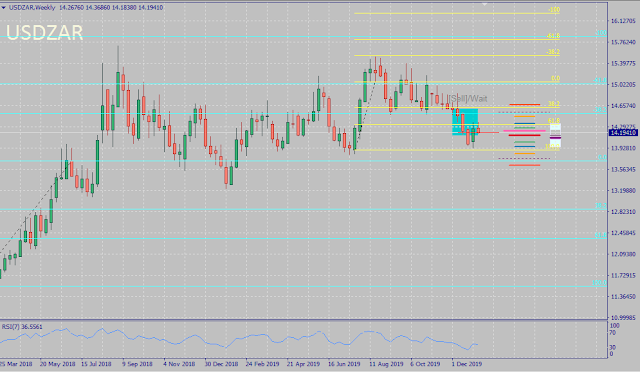
Both USDMXN and USDZAR prices moved within the forecasted range as well.
Back to Top
Unlike the revised 2008-2018 seasonality with 2 crosses having sub 60% win-rate: CHFJPY (57%) and EURCAD (59%), the 2009-2019 seasonality doesn't have one. All majors and crosses (and even USDMXN and USDZAR) all showed above 60% win-rate each.
But then again, past performance never guarantees future results (especially once the trade deal is signed, and there's also upcoming US Presidential election later this year), so let's see how it goes. 👀
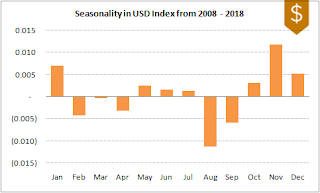
Seasonality for US Dollar Index still shows the same pattern overall, with a few reversals during the middle of the year and October. Based on this month's seasonality, expecting DXY to recover a bit-- probably until 97.6 especially if the trade deal pushes through, before possibly falling down to 95.4 which is the 0 fibonacci (base level) in the weekly chart.
Seeing its current bearish trend now, I think it's already late to ride this month's seasonality in the next few weeks especially with DXY possibly rallying a bit soon. Oil's chart pattern and price action hint at a possible consolidation soon.
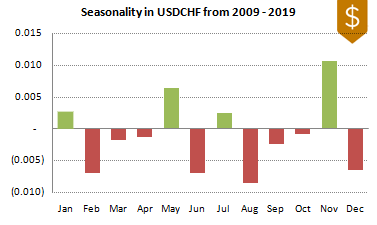
Given its seasonality bias for Q1, it's possible that this pair will go down further to near 0.955 especially if markets become more risk-off. But for this month, expecting it to either stay flat, if not recover a bit back to 0.98.
Back to Top
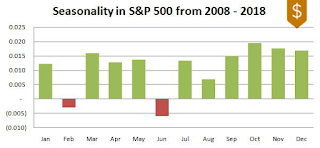
Since seasonality win-rate for S&P500 is a dismal 55%, still won't rely on that but on elliot wave instead (which is the better "rhythm" in stocks in general since they tend to continue a trend for a longer time, unlike FX pairs which follows a mean reversion rhythm-- hence this FX seasonality post). More about that and this month's forecast on equities in a separate post.
It's still pretty interesting to note how S&P500 consistently dips around August -- aka the Chinese ghost month lol!
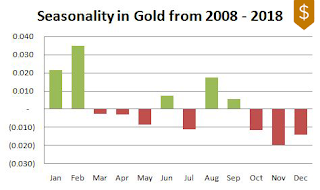
Despite some consistency in its seasonality (similar to USDJPY) with only increased volatility as the difference, latest seasonality of XAUUSD only gave the worst win-rate of 49%, down from 55% last year. As mentioned in previous posts, metals are both highly volatile and highly manipulated so there's no surprise there.
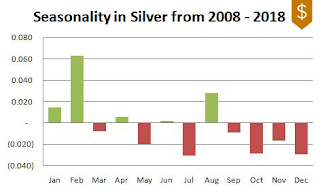
Same with XAUUSD. The sudden bullish reversal in September was probably JP Morgan buying more and more silver (& possibly manipulating its price) around late August, before the expected additional 10% tariff by US against China last September 1 and sudden reversal of silver few days after that, followed by a probe of some of JP Morgan's execs.
Latest seasonality for XAGUSD gives 50% win-rate, down from 52% last year -- the same odds as tossing a coin lol.
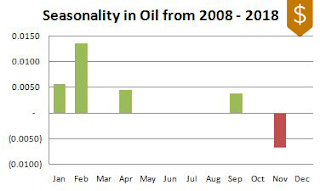
Seasonality of oil is slightly better than metals at a consistent 58% win-rate-- a relatively consistent-looking seasonality chart as well.
Back to Top
Featured photo by Burak.
Also wanted to avoid geopolitical risks around that time: UK general election and US-China trade deal, with only Phase 1 of that deal's official signing delayed from December to January 15 (which convinces me that the main focus for at least the first half of 2020 is still more US-China "talks", more likely causing the equity market to see-saw between 3100-3500. It's pretty much aligned to its elliot wave but I'm gonna talk about that in another post later).
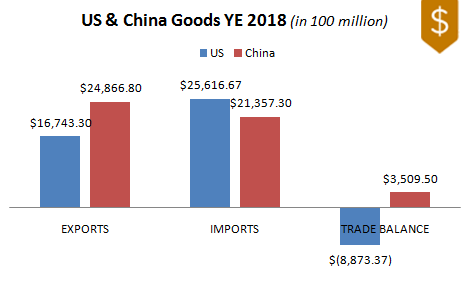 |
| Source: US Census Bureau & National Bureau of Statistics of China |
No final figures available yet for 2019 year end-- will update this soon.
Even if my decision to focus more on other things that time (i.e. Amazon FBA, Youtube and my other blog) seemed fairly reasonable because we must take advantage of higher demand, higher traffic and better than average CPM rate around the holiday season, there's still that lingering regret especially after seeing how the prices moved as expected below.
Oh wait, I had slow internet issue around that time as well. I guess it's alright afterall then. 😆
I. Outcome of FX Seasonality-Based Prediction for November - December 2019
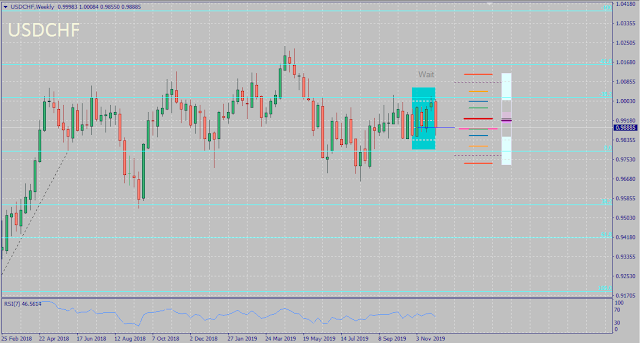
Most currency pairs moved within the expected range for November - December 2019, except for NZDUSD last November, and USDCAD and USDCHF last December.Although based on fundamentals, I've mentioned in the previous posts how underrated the Kiwi is overall, I didn't expect it to bounce and recover that early especially with risks related to Australia and US-China talks.
When it comes to Swissie, more whales were definitely more into it than usual (just like gold) to hedge current risks in the market.
And regarding the Loonie, it's being supported by the recovery in oil because of rising demand during winter-- and expecting it to even rise further after what happened to Iran lately, despite the bearish seasonality forecast for December in oil.
AUDUSD
EURUSD
GBPUSD
NZDUSD
USDJPY
USDCAD
USDCHF
XAUUSD
XAGUSD
XTIUSD
The FOMO both in the S&P 500's daily chart and the news continues. However if we look at the higher timeframe, it's relatively flat. But contrary to what I initially thought, it's more likely that no impending stock market crash is coming soon (or at least this month) especially with some whales biased against it (or are they doing that so the actual whales won't cash out yet? Hmmm..), and expecting the equities now to continue moving sideways instead.
Both USDMXN and USDZAR prices moved within the forecasted range as well.
S&P 500
USDMXN
USDZAR
II. Forecast for January 2020 Based on Recent 10-Year FX Seasonality
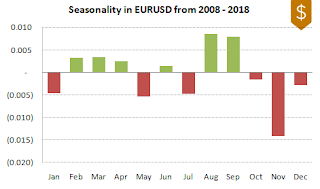
After updating the historical data to reflect the most recent 10-year average monthly price movements and changing the Buy-Sell-Wait tags to reflect updated seasonality, overall average win-rate of majors and crosses during backtesting slightly improved from 64% to 66% (can be higher if accompanied with price action and other trading strategies especially if automated).Unlike the revised 2008-2018 seasonality with 2 crosses having sub 60% win-rate: CHFJPY (57%) and EURCAD (59%), the 2009-2019 seasonality doesn't have one. All majors and crosses (and even USDMXN and USDZAR) all showed above 60% win-rate each.
But then again, past performance never guarantees future results (especially once the trade deal is signed, and there's also upcoming US Presidential election later this year), so let's see how it goes. 👀
DXY
AUDUSD
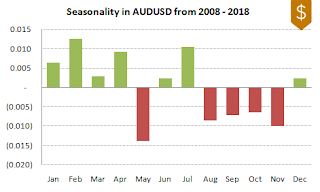
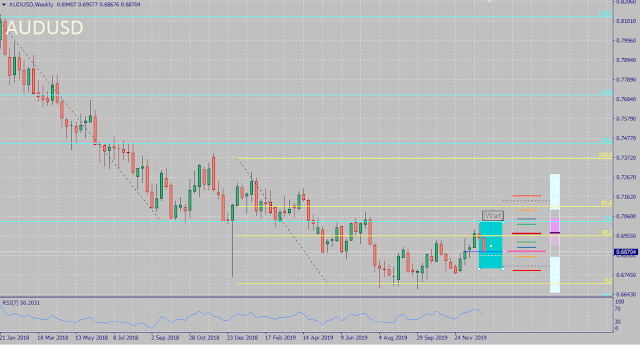
AUDUSD on the other hand, now changed the bullish months during the early part of the year down to flat-- which I think might be attributed to trade and recession fears. With that said, expecting this pair to continue moving sideways instead of reversing up soon.EURUSD
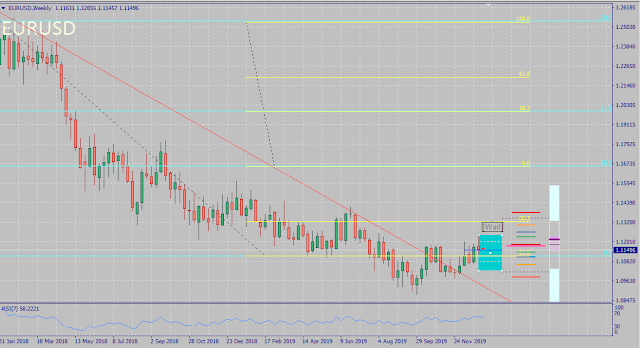
EURUSD's seasonality is gearing towards less volatility overall during Q1. Like AUDUSD, expecting EURUSD to move sideways this month instead of significantly reversing up.GBPUSD
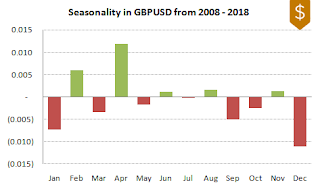
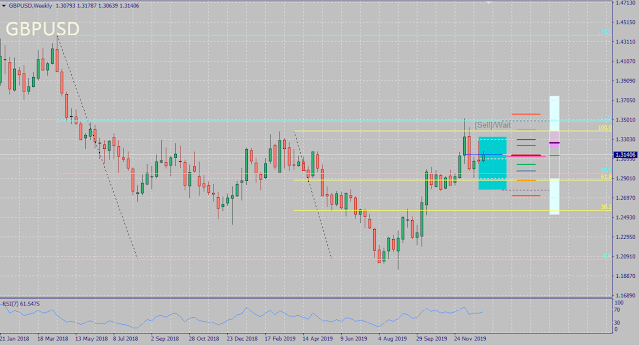
GBPUSD's seasonality last year and this year still looks pretty similar overall, except for the dramatic bearish reversal by June immediately right after Theresa May's resignation... uhmm last May, as UK scrambled to find a new Prime Minister. For this month, expecting the pound to move sideways-- if not move down to 1.29.NZDUSD
NZDUSD's seasonality also looks a bit similar still-- just some minor change around March and June, and less bearishness around October right after Moody reaffirmed its AAA rating with the IMF also seeing how underrated it is. Despite that and this month's seasonality, having recovered earlier than expected, NZDUSD is most likely to consolidate down to 0.655-0.66 in the next few weeks before possibly rising up again towards 0.70.USDCAD
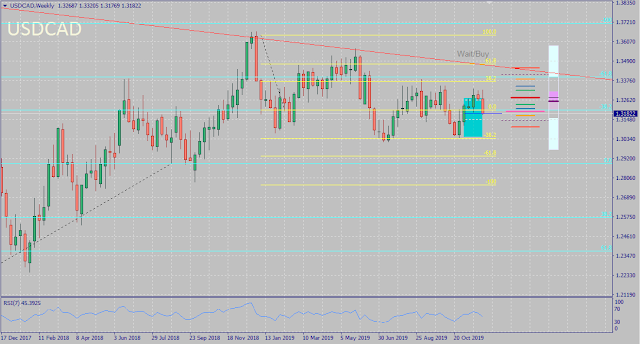
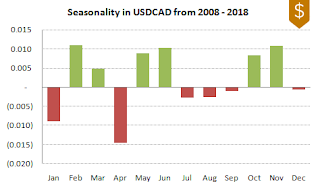
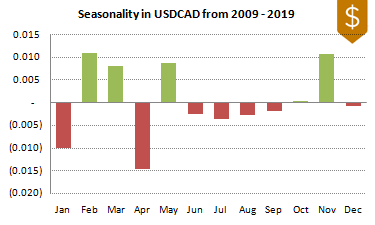
USDCAD's seasonality still looks almost the same, with some changes around its June and October trend which possibly reflects the negative side effect of China's tariff retaliation last June (right after the Huawei ban last May), and recovery in oil and slump in dollar at the start of October (after the Aramco attack last September, as well as more US-China trade uncertainties).Seeing its current bearish trend now, I think it's already late to ride this month's seasonality in the next few weeks especially with DXY possibly rallying a bit soon. Oil's chart pattern and price action hint at a possible consolidation soon.
USDCHF
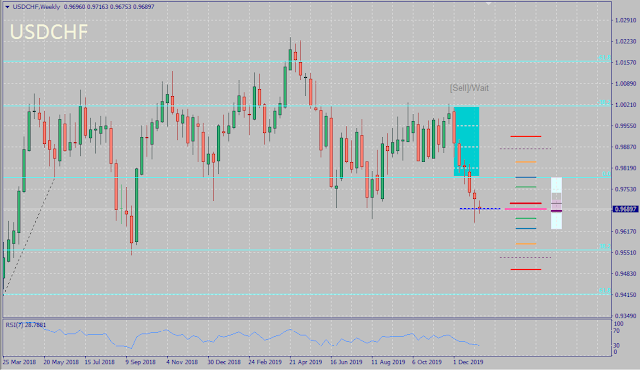
USDCHF's seasonality also looks the same still for the most part, with reversal on January (which I'm not sure of yet why...), as well as in October reflecting the reversal in DXY at the beginning of that month last year because of the US-China trade uncertainties.Given its seasonality bias for Q1, it's possible that this pair will go down further to near 0.955 especially if markets become more risk-off. But for this month, expecting it to either stay flat, if not recover a bit back to 0.98.
USDJPY
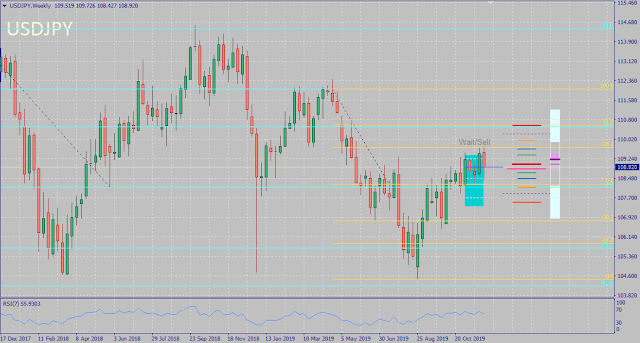
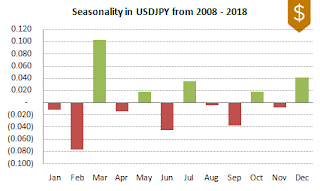
USDJPY has the most consistent seasonality pattern among majors and highest win-rate (81%) during backtest (but again, past performance doesn't guarantee future success especially there are also other factors such as entry and exit points). For now, it's best to wait a bit before selling.Back to Top
III. Seasonality Update in S&P 500, Oil and Metals
Given the low win-rate in S&P 500, metals and oil when applying this seasonality strategy alone as shown below, moving forward I'll be creating separate posts about them instead of bundling them in my monthly FX seasonality post so it's not confusing. I plan to expound on them further the way I actually analyze them before trading, instead of just dumping screenshots of forecast and results here without enough explanation lol.S&P 500*
It's still pretty interesting to note how S&P500 consistently dips around August -- aka the Chinese ghost month lol!
Gold*
Silver*
Latest seasonality for XAGUSD gives 50% win-rate, down from 52% last year -- the same odds as tossing a coin lol.
Oil*
Featured photo by Burak.



























0 comments:
Post a Comment